
Client:
Canadian Marketing Association (CMA)
Team:
LP/AD
What's my role:
Graphic design, Wireframing & Prototyping
Tools:
XD, Illustrator
The CMA is the voice of the marketing profession and is a community-based association in Canada. They provide opportunities for their members to build relationships, develop professionally, and influence the regulatory climate, to help marketing bolster business success.
They support activities related to thought-leadership, professional development, consumer protection, and commercial success. They act as the primary advocate for marketing with governments, regulators and other stakeholders.
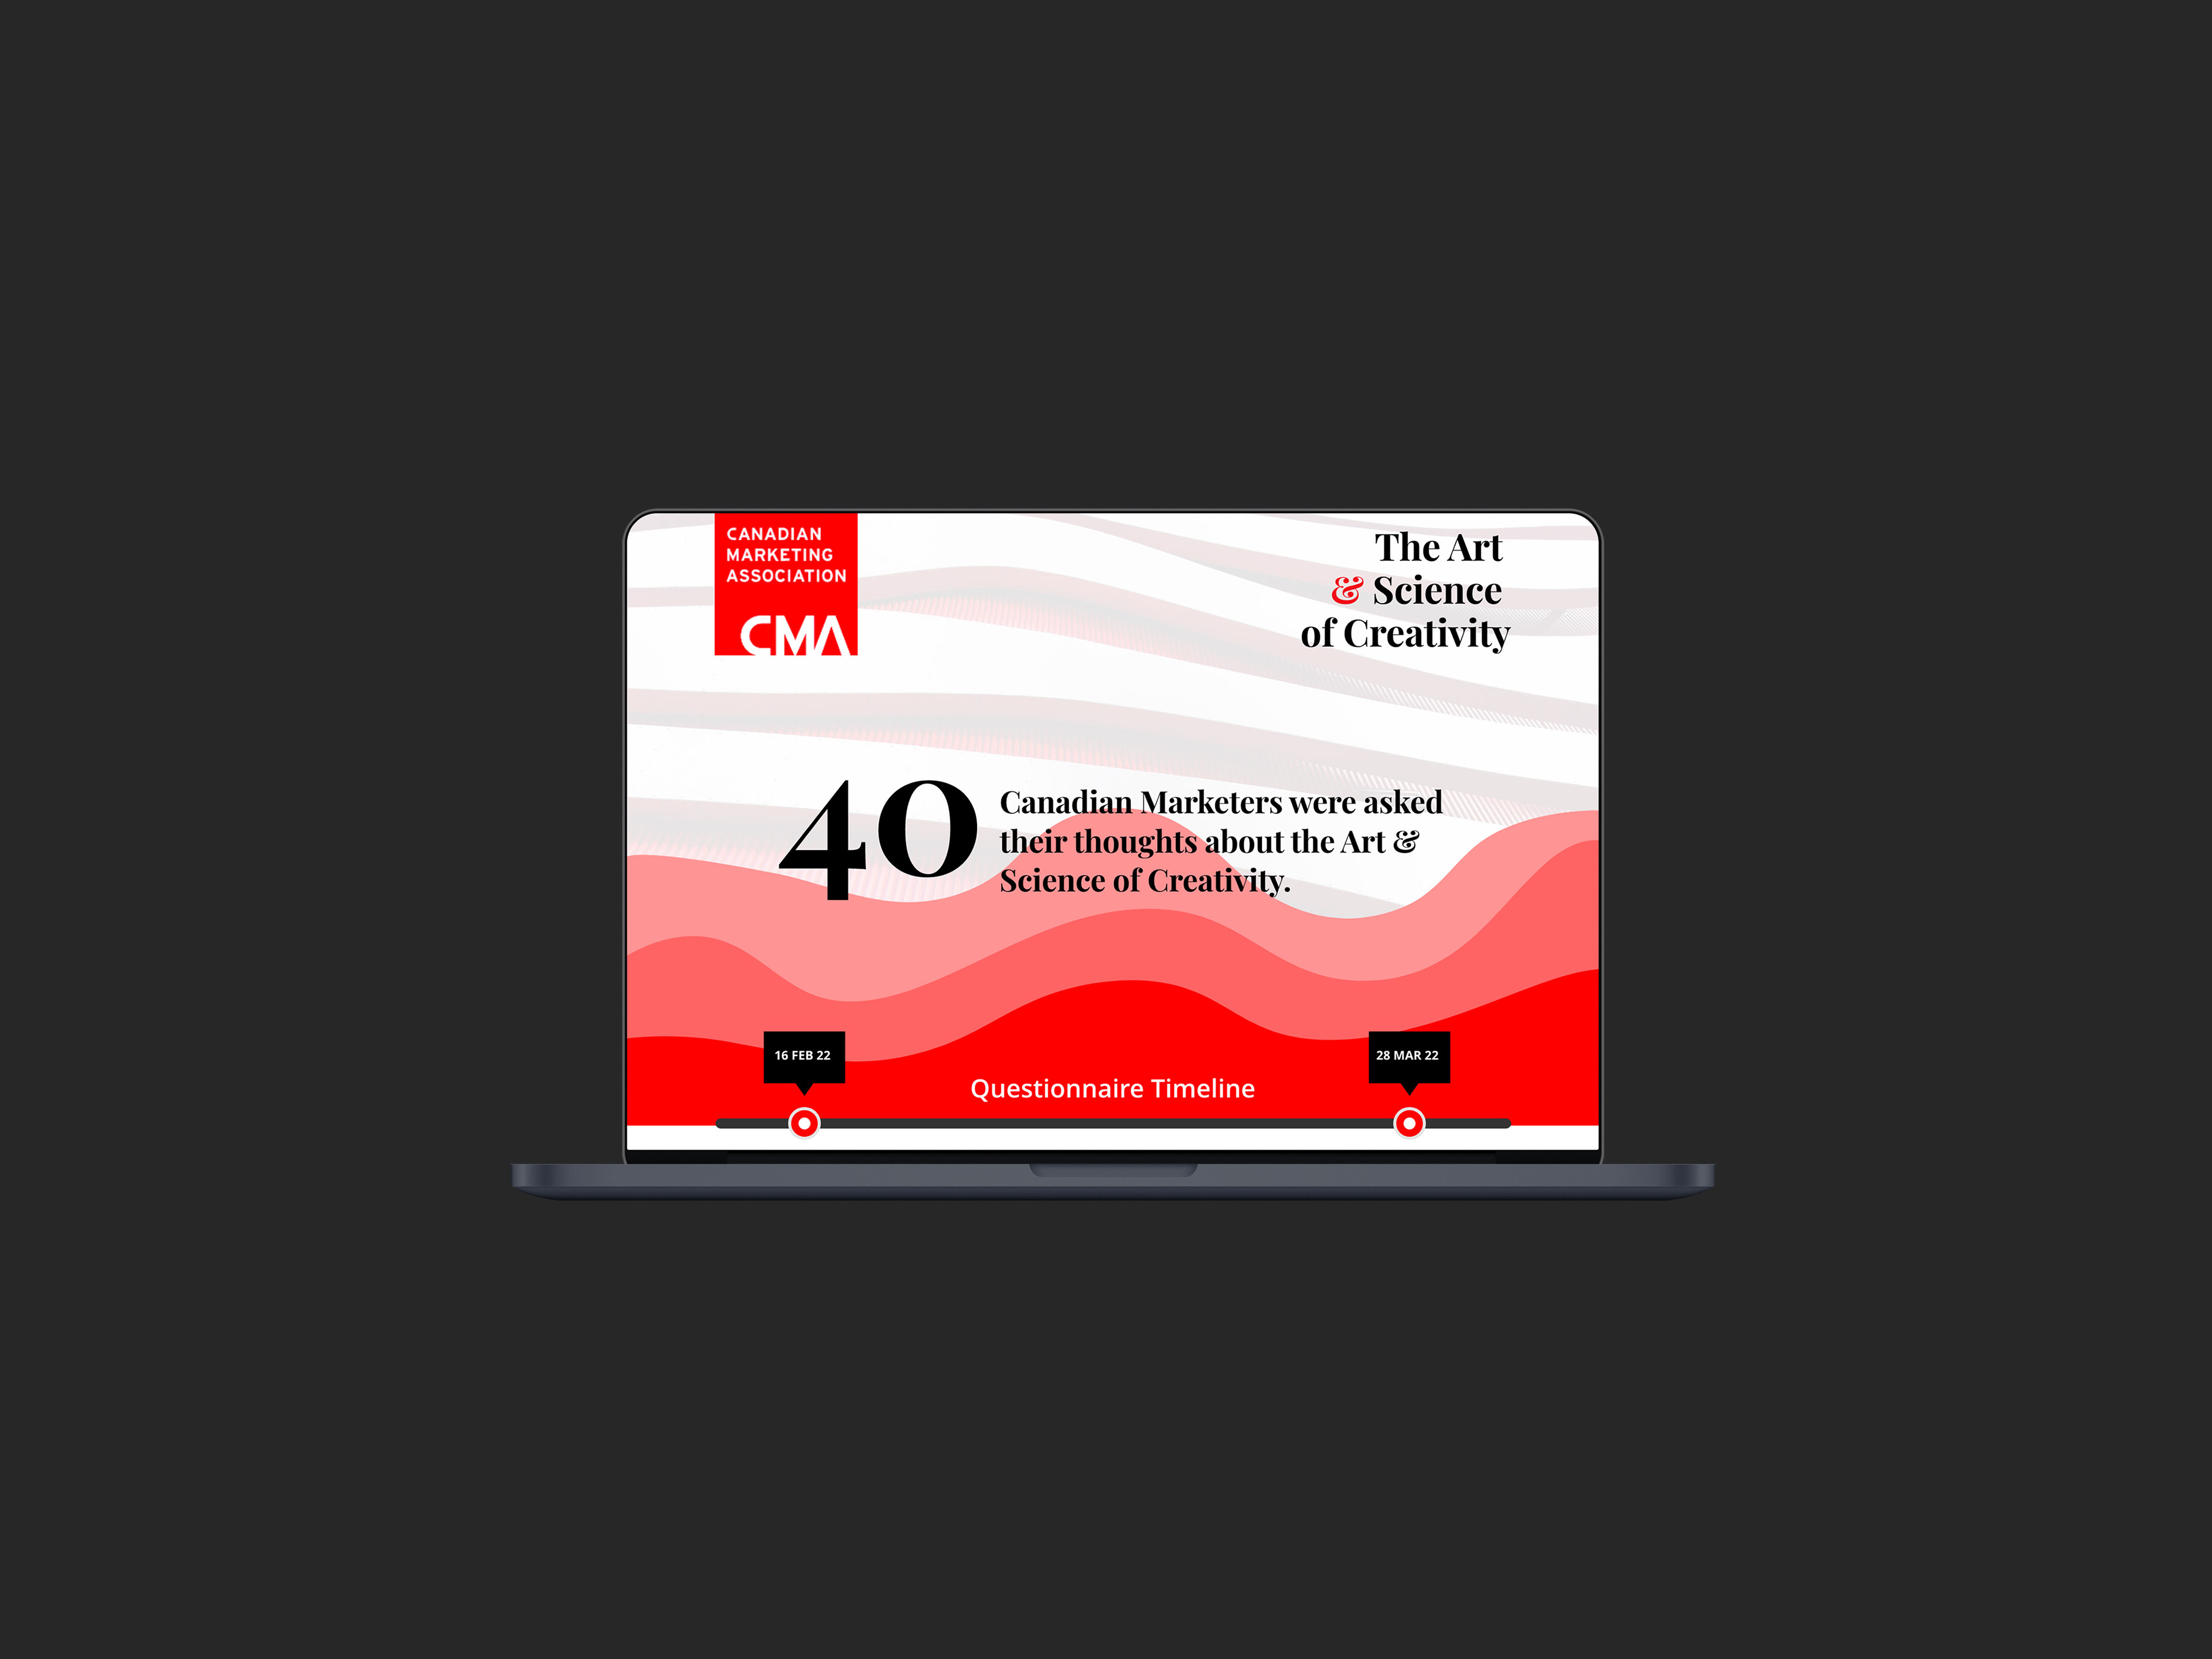
This data visualization project was meant to be a static infographic. But to enhance the graphics and charts, I decided to create an interactive version of the final output.
40 Canadian marketers were asked a few questions about Art and Creativity. The infographic justifies those questions in a more interactive and fun way.
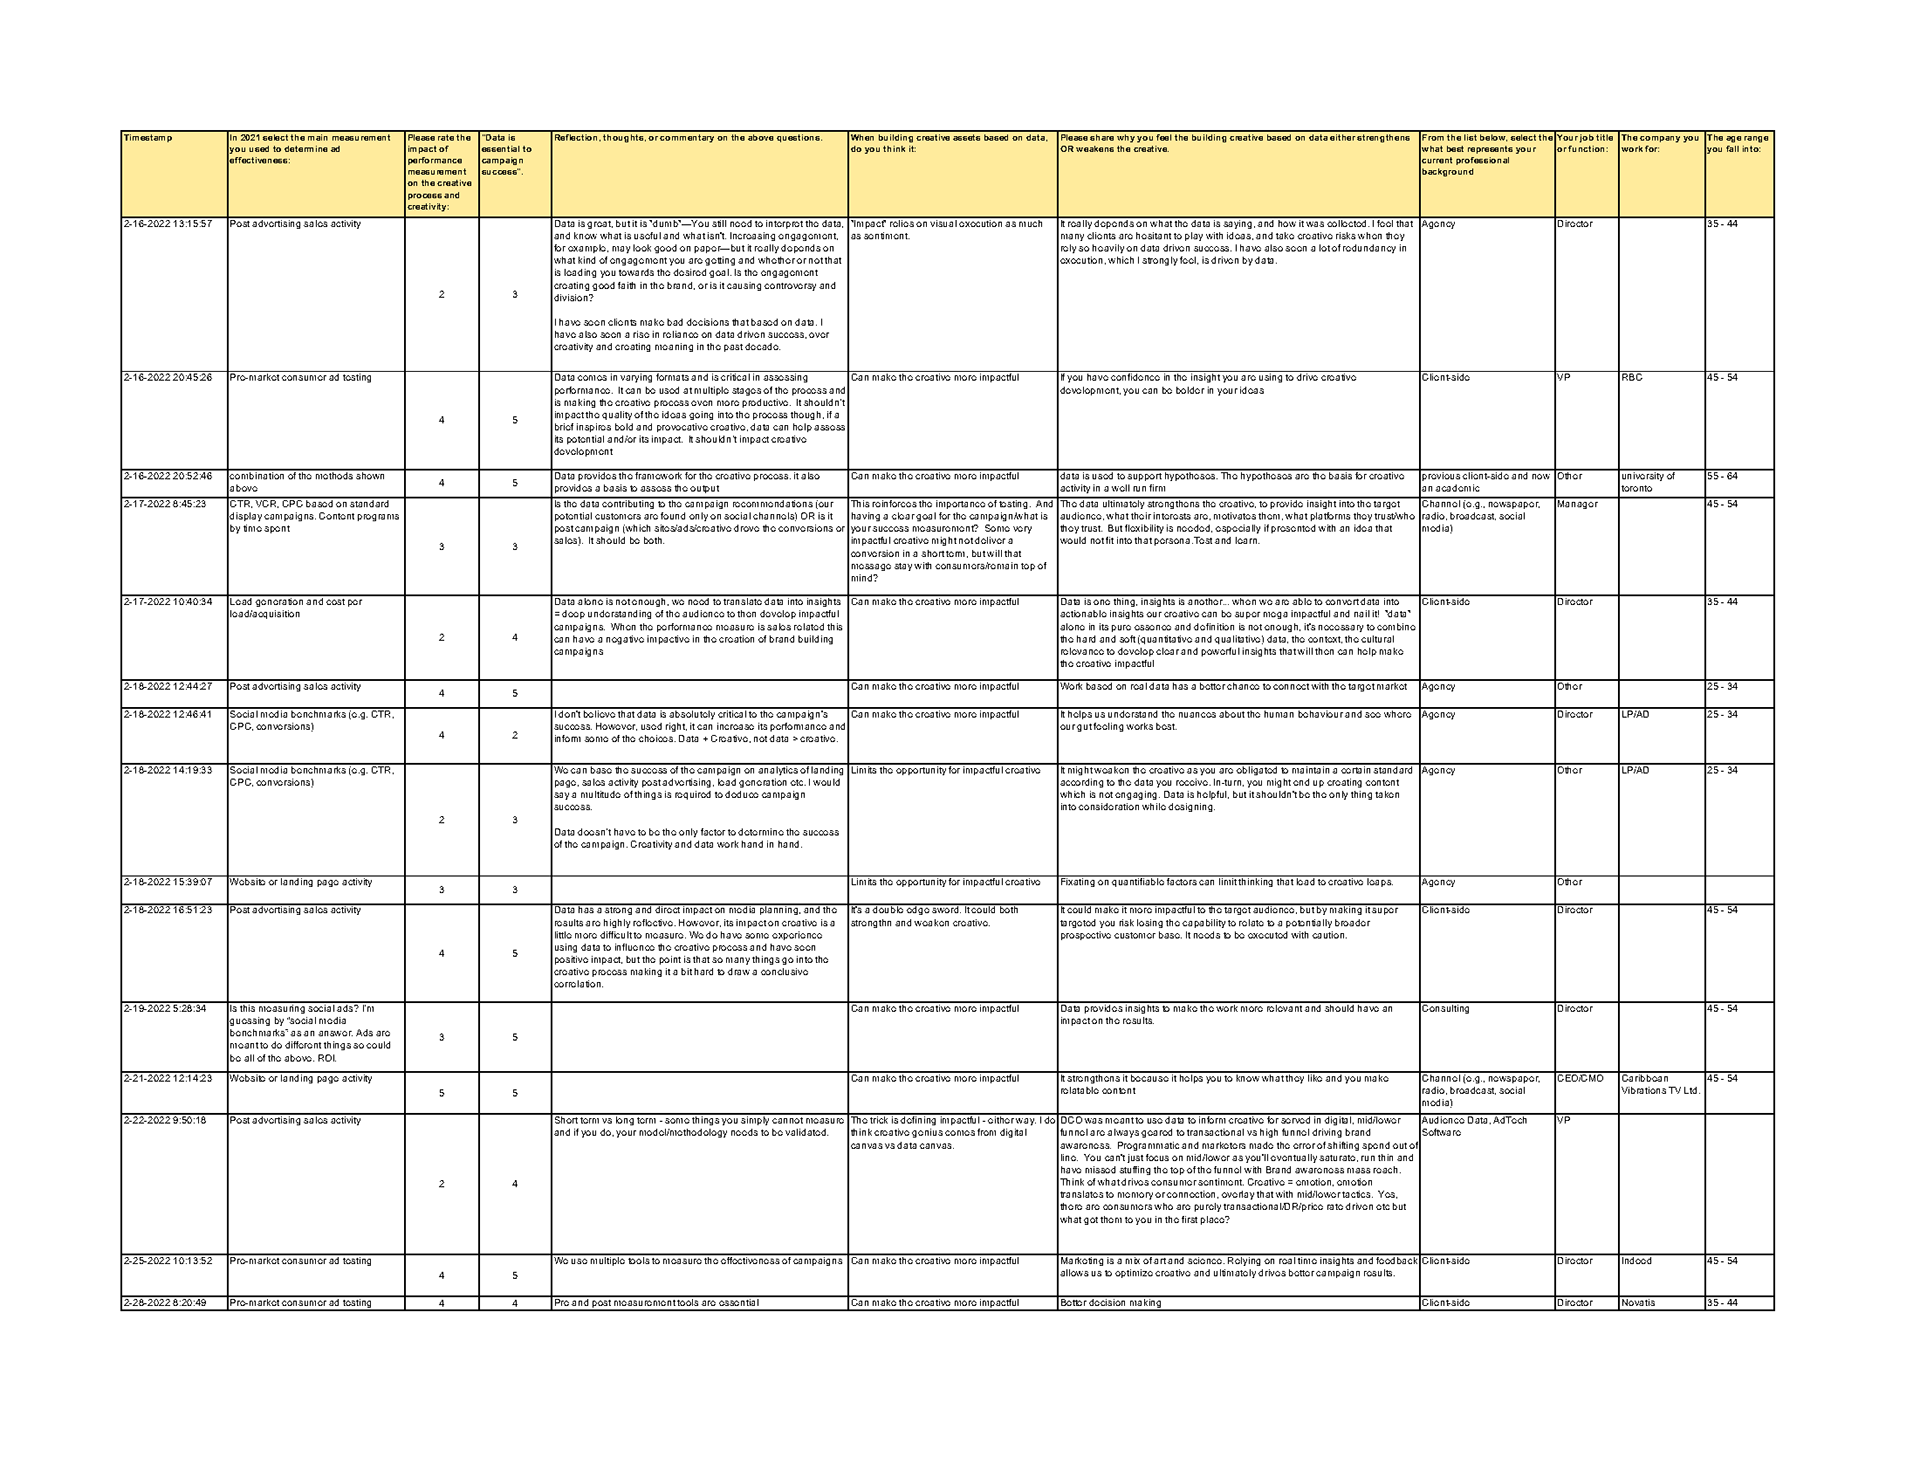
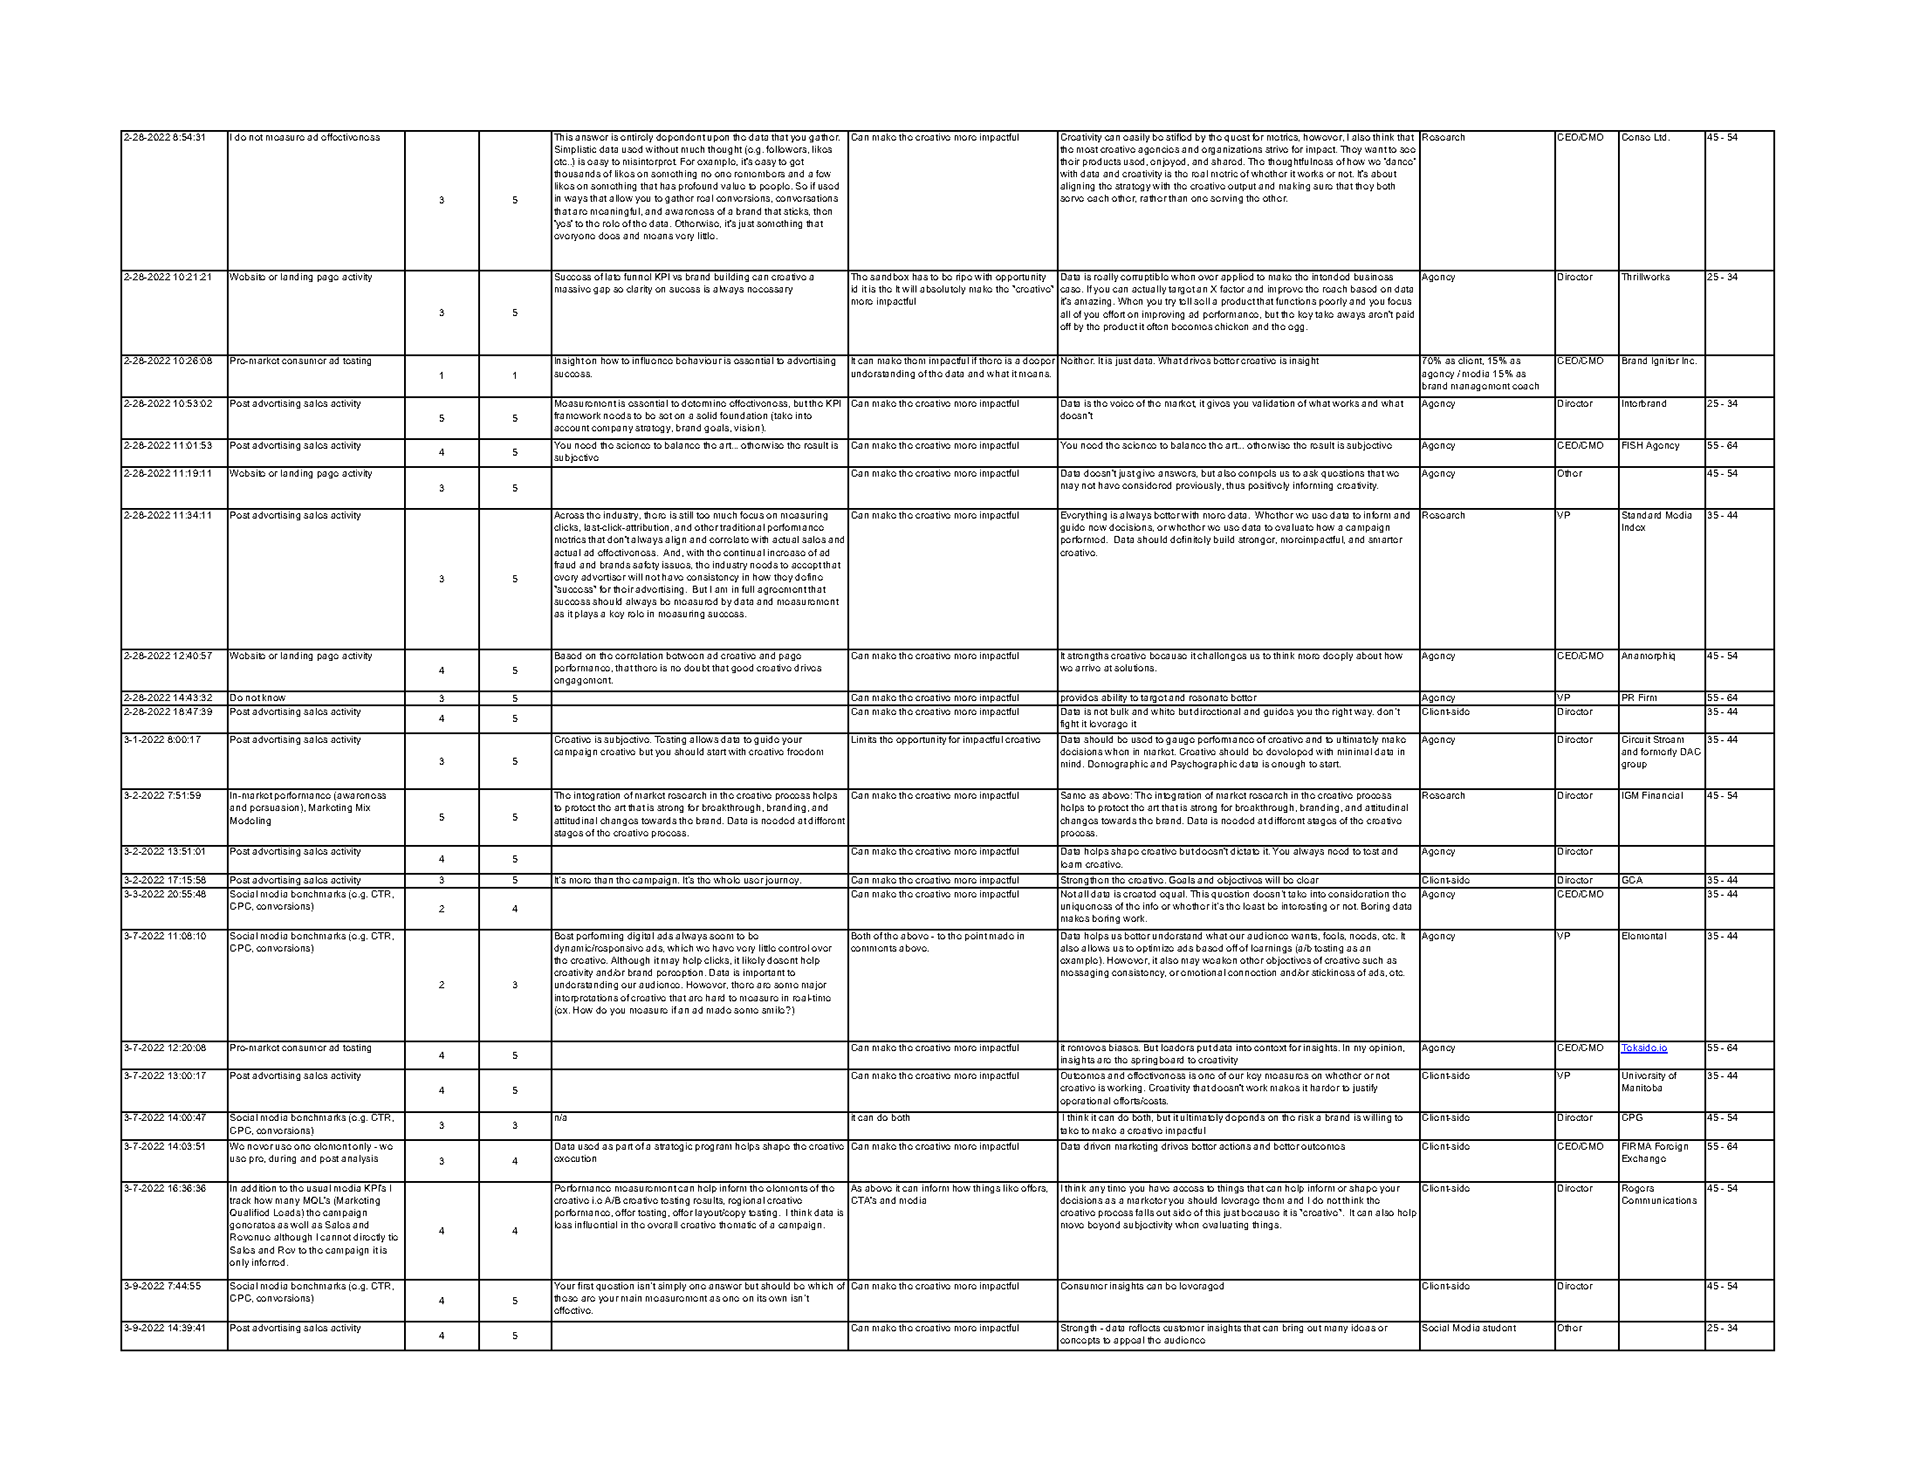
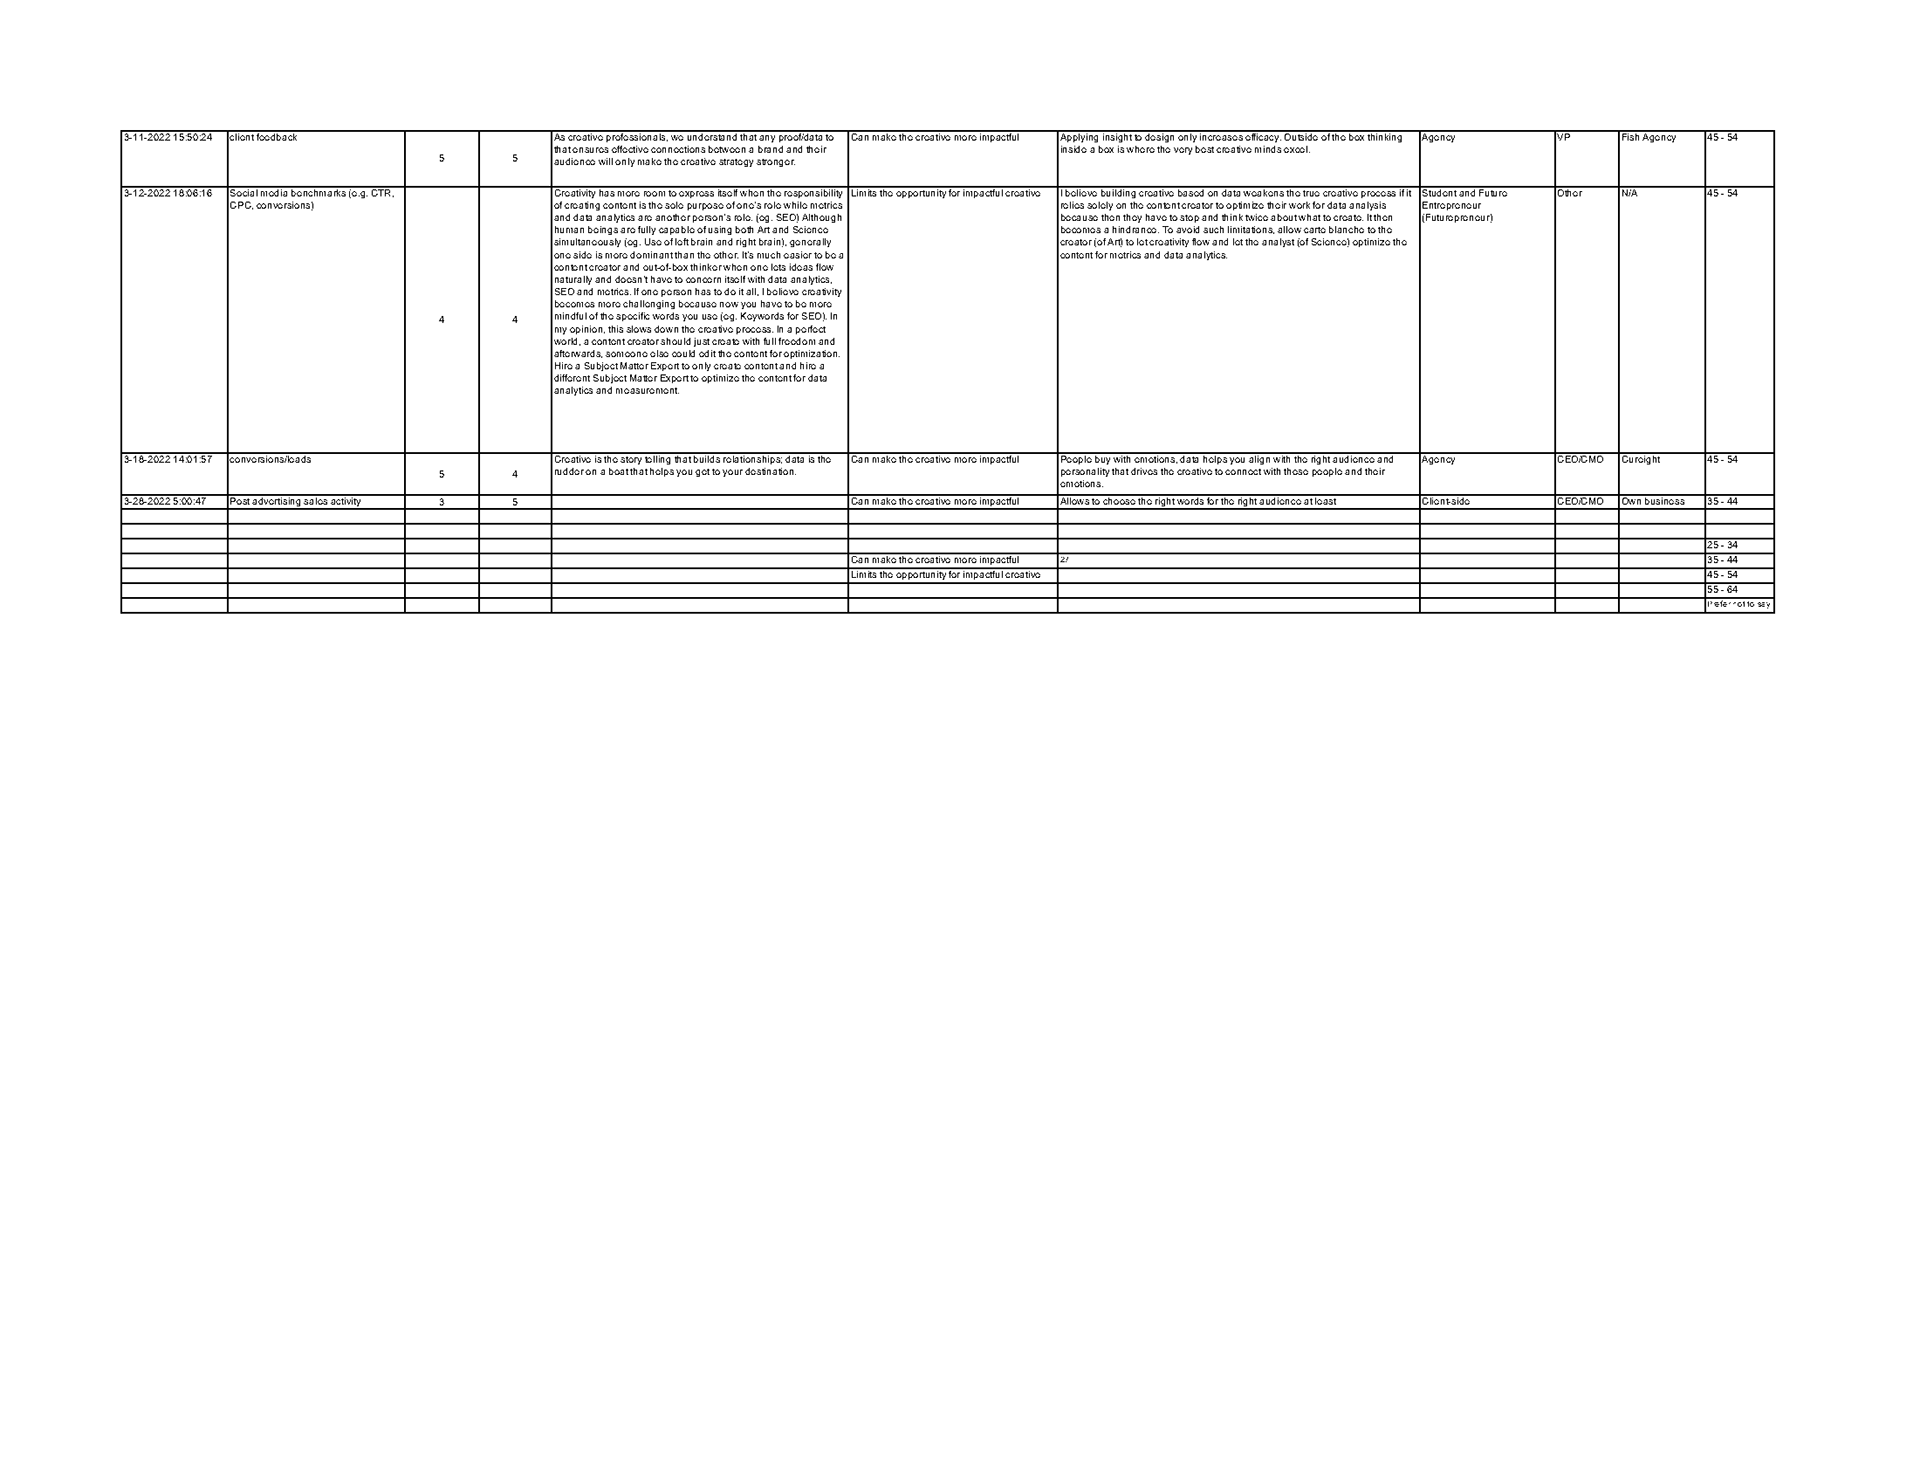
Quantitative Research
The survey was then documented in an excel sheet. Based on the quantitative analysis, the following graphs and charts were then created.
Initial sketches
Here are some of my rough sketches to show the basic layout of the wireframe and a few other key elements.
Before/After Interaction
These states show the default state vs toggle state in the prototype. You would be able to interact with the prototype yourself to see some microinteractions.
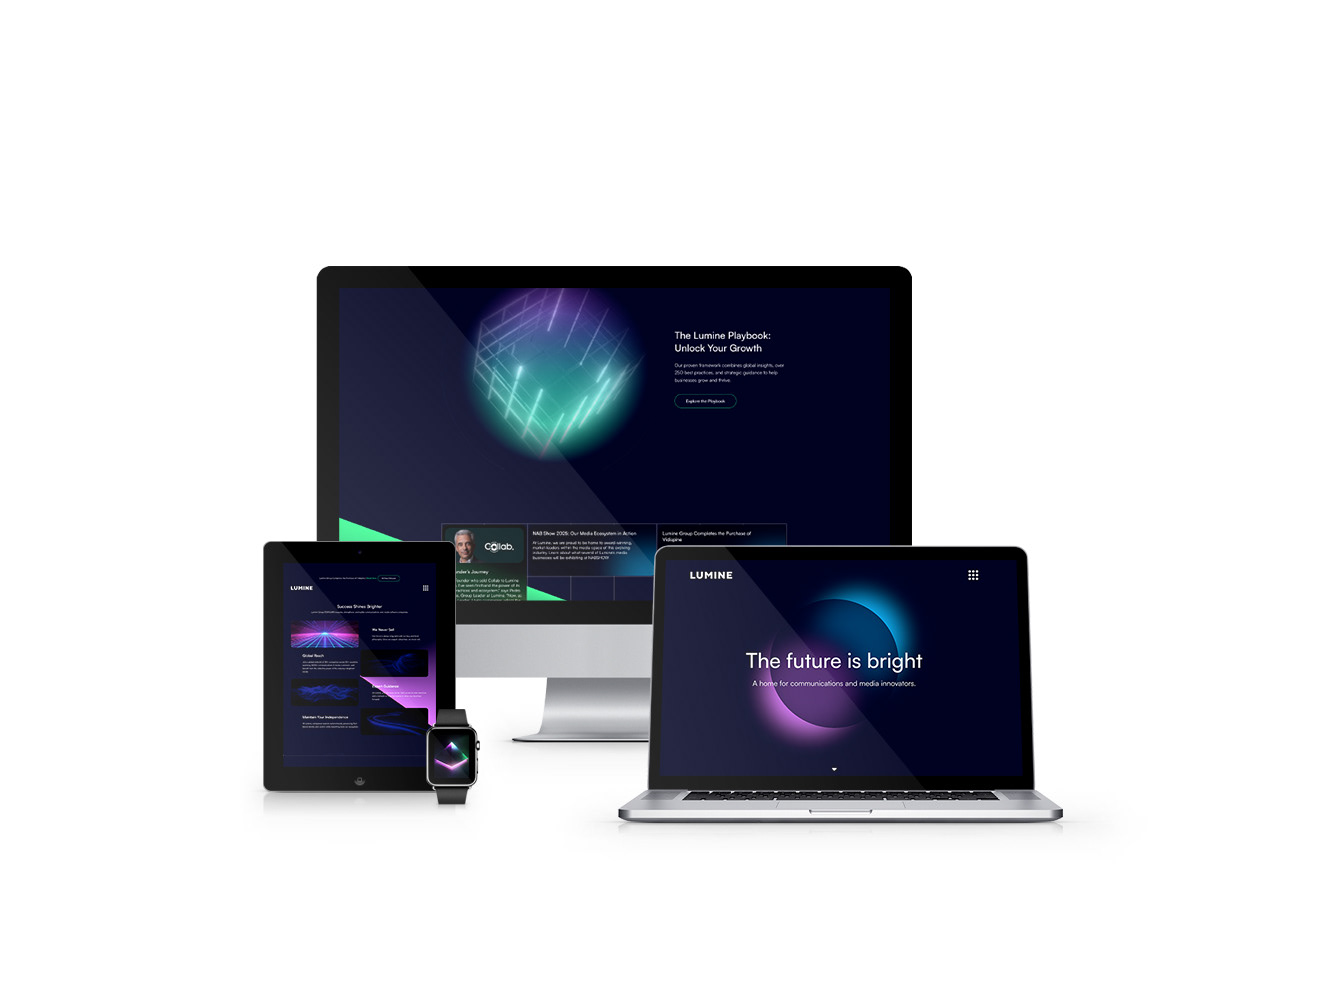
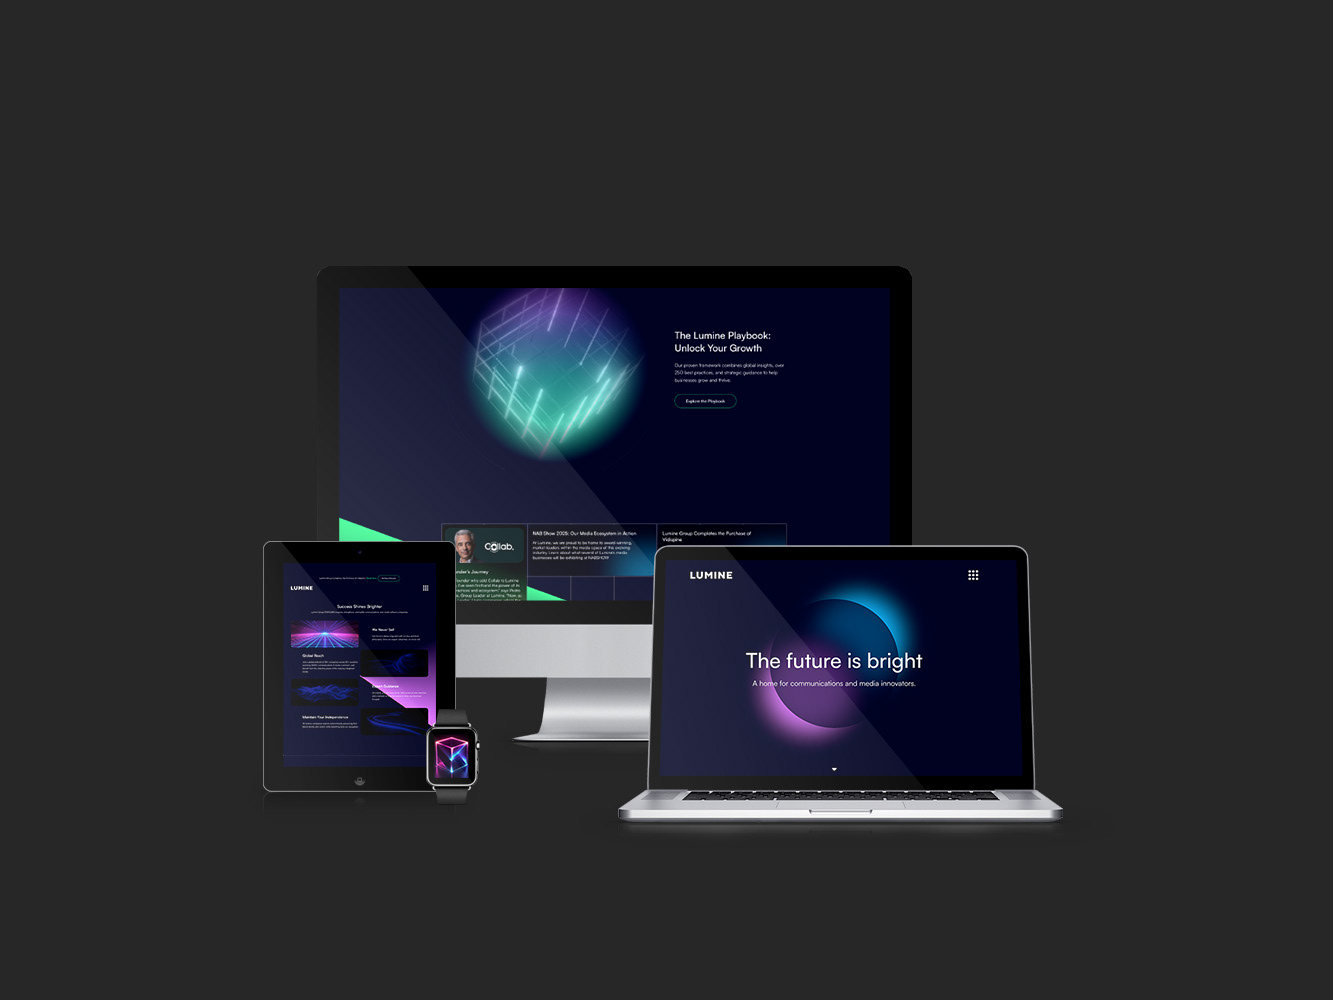
Clickable Prototype
This is a Clickable Prototype designed in an interactive format to make the charts and graphs more lively and vibrant. When the site launches it will have a 3-5 sec intro animation. Once the animation is complete, you would be able to scroll down to view the charts and pointers.
To see the effect per chart you’d need to click on each element. But prior to doing that, make sure to have the section “title” + “chart” in your full viewport. I’ve added a toggle effect to each chart, to reverse the effect to the original state.